tbh those sort of videos don't impress me, as there are too many unknowns, such as the drivers' relative capabilities, camera lenses can be deceptive (either way), etc. It looks like Top Gear, just a bunch of people larking about. That's just me though. Some people will like them.
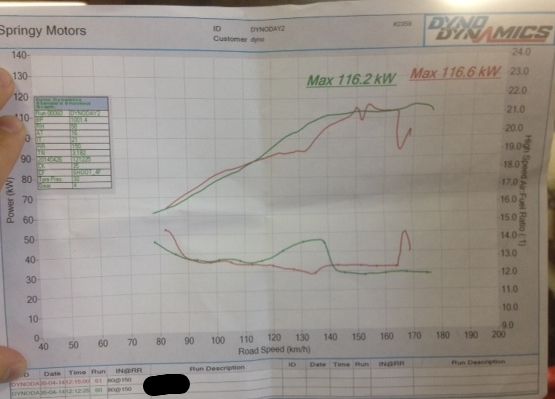
But I am impressed with those two plots in #38.
I don't understand Steve's comment in #32 where he says "We all know Dynos are very subjective" ....err videos are subjective, dyno plots are objective. If it's a test-bed dyno (where the engine shaft is connected to the dyno) then it gives clear data on the engine. If it's a rolling-road dyno (where the power at the wheels is measured) then it gives clear data on the performance on the road. What I don't like to see, is a rolling-road plot where the engine power is inferred. As far as I am concerned, a rolling-road dyno graph must always include the power plot (or torque plot) at the wheels, if it doesn't then the plot is neither objective nor subjective, it's just totally useless, like a video taken at night in the dark with no lighting.
I also don't get some of Sergey's comments, for example in #38 "Dyno is WOT testing but u drive at WOT just maybe 2-3% of whole engine life and the only way to understand all the benefits of reflash is a testdrive". Surely those videos are also WOT ??
and "Dyno plot isnt the best way to understand engine" .... what else is there to display the results ??
I can only talk about my requirements (daily driving on my car is fine) : With a reflash I don't care about the DBW, and I don't care about mpg. What I want is more life at the top end, which Honda have obviously removed when the K24 first came out: shockingly un-aggressive cams, appallingly late VTEC engagement, and anything else to make sure that the engine would last for a minimum of 7 years (that's their max warranty period).
So, back to those plots : I've downloaded them and put them up side-by-side, and the difference is clear to me. They look good, that's what I want to see. If you do a side-by-side comparison, try to get both "at-wheels" plots on the same graph. i.e. if possible: One graph power-at wheels (side-by-side), one graph torque at wheels (side-by-side). Also state the road speed on the car's speedo at a stated rpm (e.g. 6000, or 7000, or whatever). Atmospheric conditions would be nice to know, but since it's a side-by-side in the same car within an hour, it doesn't matter (the percentage difference that atmospheric conditions give are not significant to be seen on a side-by-side "at-wheels" comparison, same is true of tyre pressures)
The fact that you have found those plots in #38, and the fact that you're willing to do a side-by-side on the same car on the same dyno, says a lot to me.


") .
.